
Empower Your Business with Data: Unleashing the Full Potential of Business Intelligence Solutions
Business Intelligence Consulting
Empower Your Business with Data: Unleashing the Full Potential of Business Intelligence Solutions.
Reimagining what's possible, with commitment to getting it right
Unlock the insight hidden in your data.
where business intelligence meets innovation to drive your success. Uncover the power of data-driven decision-making with our cutting-edge Business Intelligence (BI) solutions. Elevate your business to new heights by gaining actionable insights, enhancing strategic planning, and optimizing operational efficiency.
Business Intelligence (BI)
The aim of business intelligence is to assist organizations in developing a more profound comprehension of their business, enhancing decision-making processes, and ultimately attaining strategic objectives.
Customized BI Solutions
We understand that data is the lifeblood of your business. Our BI solutions empower you to transform raw data into meaningful, actionable intelligence. Whether you're a small startup or a large enterprise, we tailor our BI services to meet your unique needs.
We employ the following BI platforms to cater to your requirements.
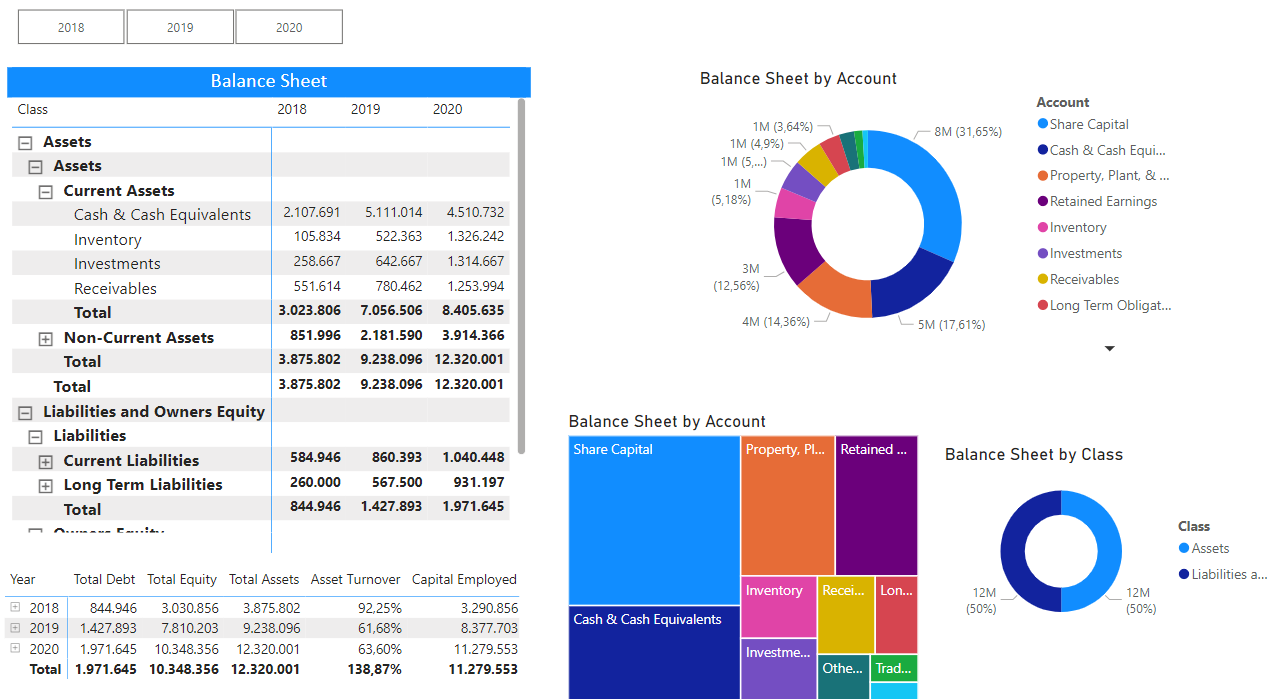
Power BI
Microsoft
Power BI is widely used across various industries for business intelligence, data analysis, and reporting purposes. Its user-friendly interface, robust features, and integration with the Microsoft ecosystem make it a popular choice for organizations of all sizes.
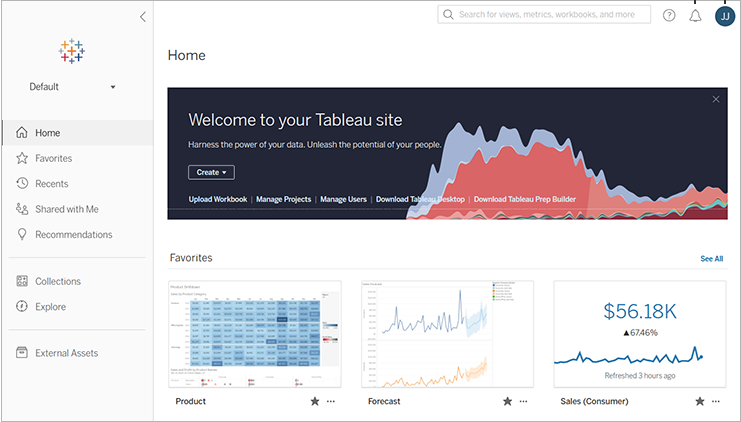
Tableau
SalesForce
Tableau is widely used in various industries, including finance, healthcare, marketing, and more, to make data-driven decisions and communicate insights effectively.
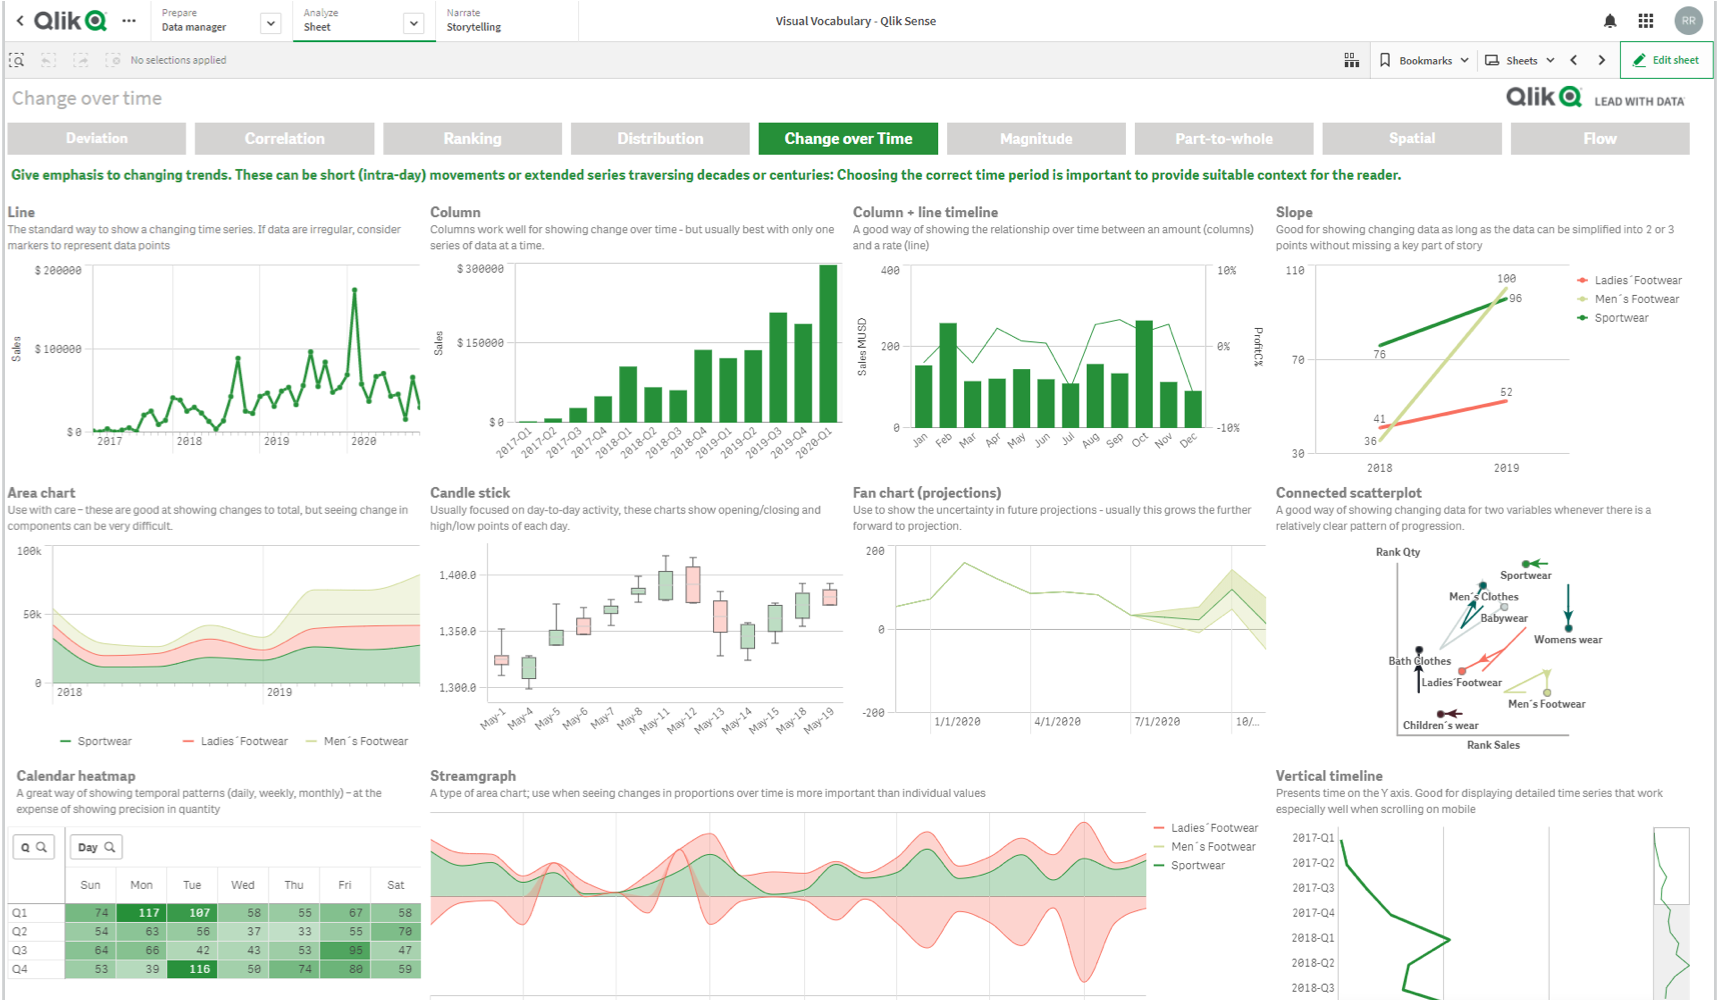
Qlik Sense
QlikTech
Qlik Sense is known for its associative data model, which facilitates dynamic data exploration and discovery. The platform is suitable for organizations looking for a self-service BI solution with interactive and collaborative features.
We make the complex simple
Data Collection
BI starts with the collection of data from various sources, including internal databases, external databases, spreadsheets, cloud-based services, and more.
Data Integration
Integration entails merging information from various sources to create a unified and cohesive perspective. This process guarantees the accuracy, completeness, and cohesiveness of the data for analysis.
Data Warehousing
Data warehouses serve as centralized repositories for storing structured, historical data collected from diverse sources. They form the essential groundwork for analytical processing and reporting.
Data Analysis
The process of data analysis encompasses the utilization of diverse techniques to unveil patterns, trends, and valuable insights. This encompasses descriptive analytics, diagnostic analytics, predictive analytics, and prescriptive analytics.
Data Visualization
Data visualization tools are utilized to visually represent data through formats like charts, graphs, and dashboards. Visualization improves comprehension of intricate datasets and expedites decision-making.
Reporting
Reporting encompasses the development and dissemination of reports and summaries generated from BI analysis. Reports can be either static or interactive and may encompass key performance indicators (KPIs) and metrics.
Dashboards
Dashboards are interactive, real-time displays that provide a visual representation of key metrics and performance indicators. They offer a quick overview of business performance.
Common issues and challenges faced by businesses in various industries.
Tell us your business challenges!
Your Next Steps
Talk to a BI consultant
Co-create with S-O Studio
Generate ideas, construct, evaluate, refine, and expand solutions effortlessly using our comprehensive framework of design thinking, agile, and DevOps methodologies. Attain rapid value and embrace cutting-edge technologies by collaborating with our team and a wide range of experts in business, design, and technology.
Contact a representative and get help with questions on how to start your journey.
Strategic Partnerships
The undeniable strength of partnership is evident in our collaborative alliances and comprehensive technology consulting services, which deliver valuable support benefits to our clients, enhancing their efficiency and performance. Key partners in our network include:


Give us a call at 06-13111305
Info@sparkoptimum.com
Ericssonstraat
5121 ML Rijen
Useful Links